Click on any of the images below for a larger version.
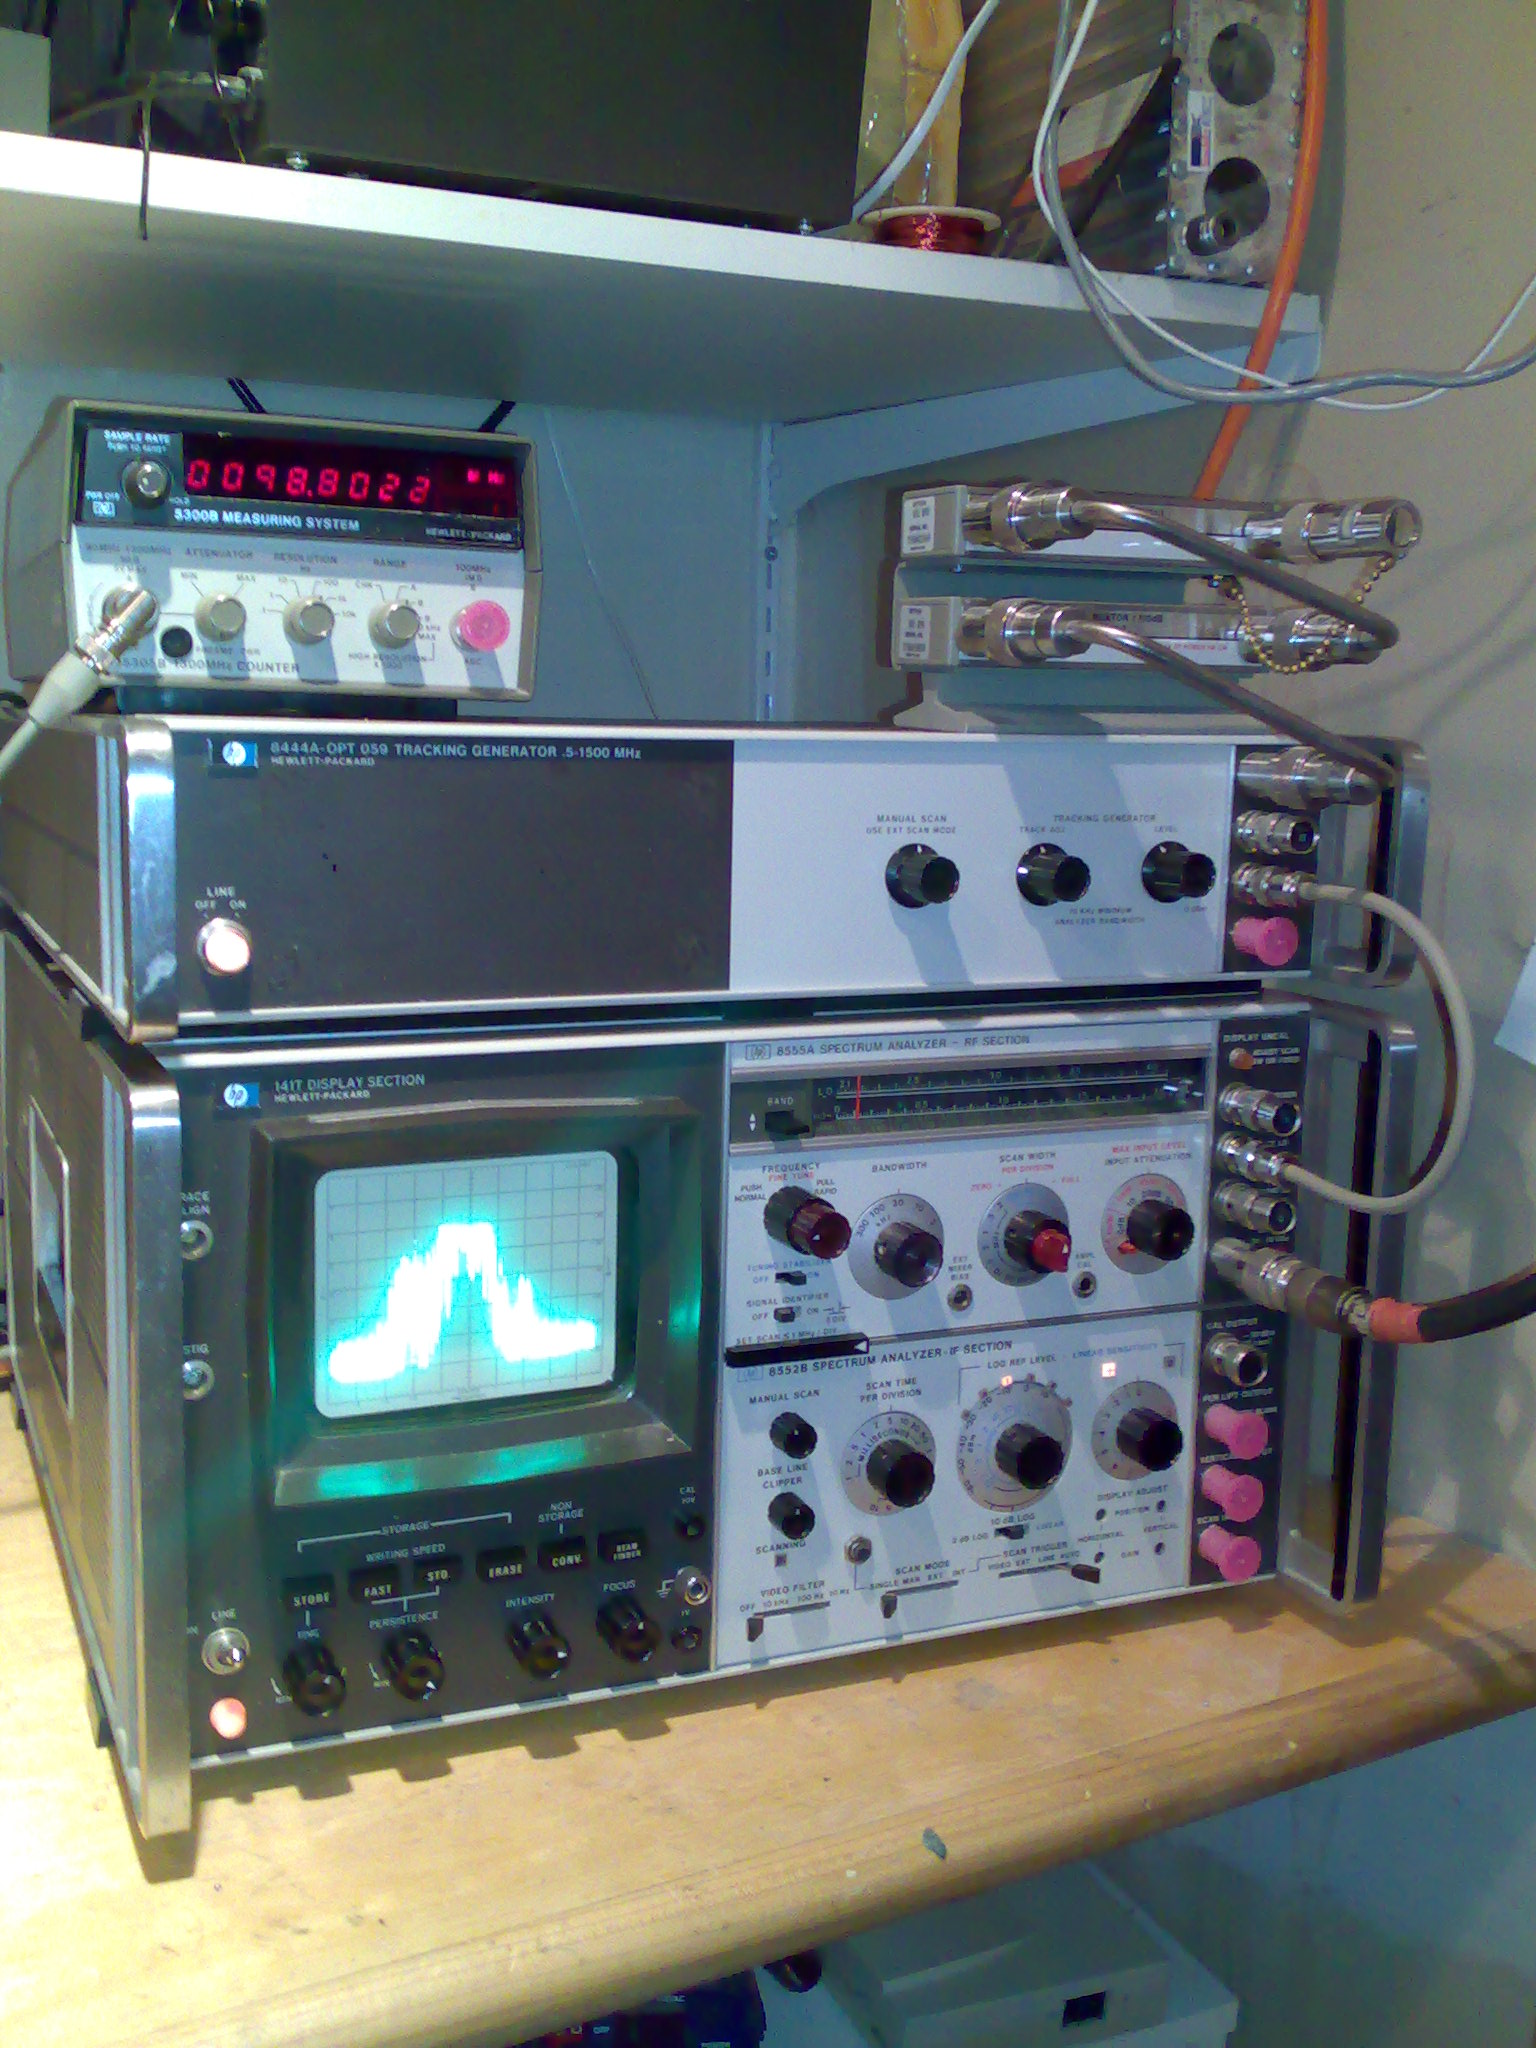
Below is an HP 8555A spectrum analyzer. It covers 100 MHz to 18 GHz as it stands. With an extra mixer unit, it can go up to 42 GHz.
It was originally designed in 1971, making you wonder what the heck anybody was doing up at 42 GHz back then. Well, these are the same people who helped put men on the moon so let's not question them.
It's actually a collection of modular components. For example, the dark-coloured display unit on the lower is a 141T, the actual spectrum analyzer module to its right is an 8555a, and just below that is an 8552B IF section.
The flat box on top is an 8444A tracking generator. This unit works with the spectrum analyzer to generate a sweep which follows that of the analyzer, which means you can analyze things like filters by connecting them between the tracking generator output and spectrum analyzer input. Put simply, as the analyzer displays a given frequency (which it does by sweeping through the spectrum) the generator makes exactly the corresponding signal.
The weird plumbing on the top and right of the tracking generator are adjustable step attenuators, one in tens and the other in single dB making for anything from 0 to 121dB with an impressive 1W dissipation. These things are almost works of art as far as I'm concerned. That's a 50 ohm terminator on the top right.
It is from this you get the signal to feed the filter under test. The output of the filter would go to the analyzer RF input.On the top left is a frequency counter (good to 1.3GHz). It connects to the tracking generator and tells you where the centre frequency is (as long as the tracking generator is turned on).
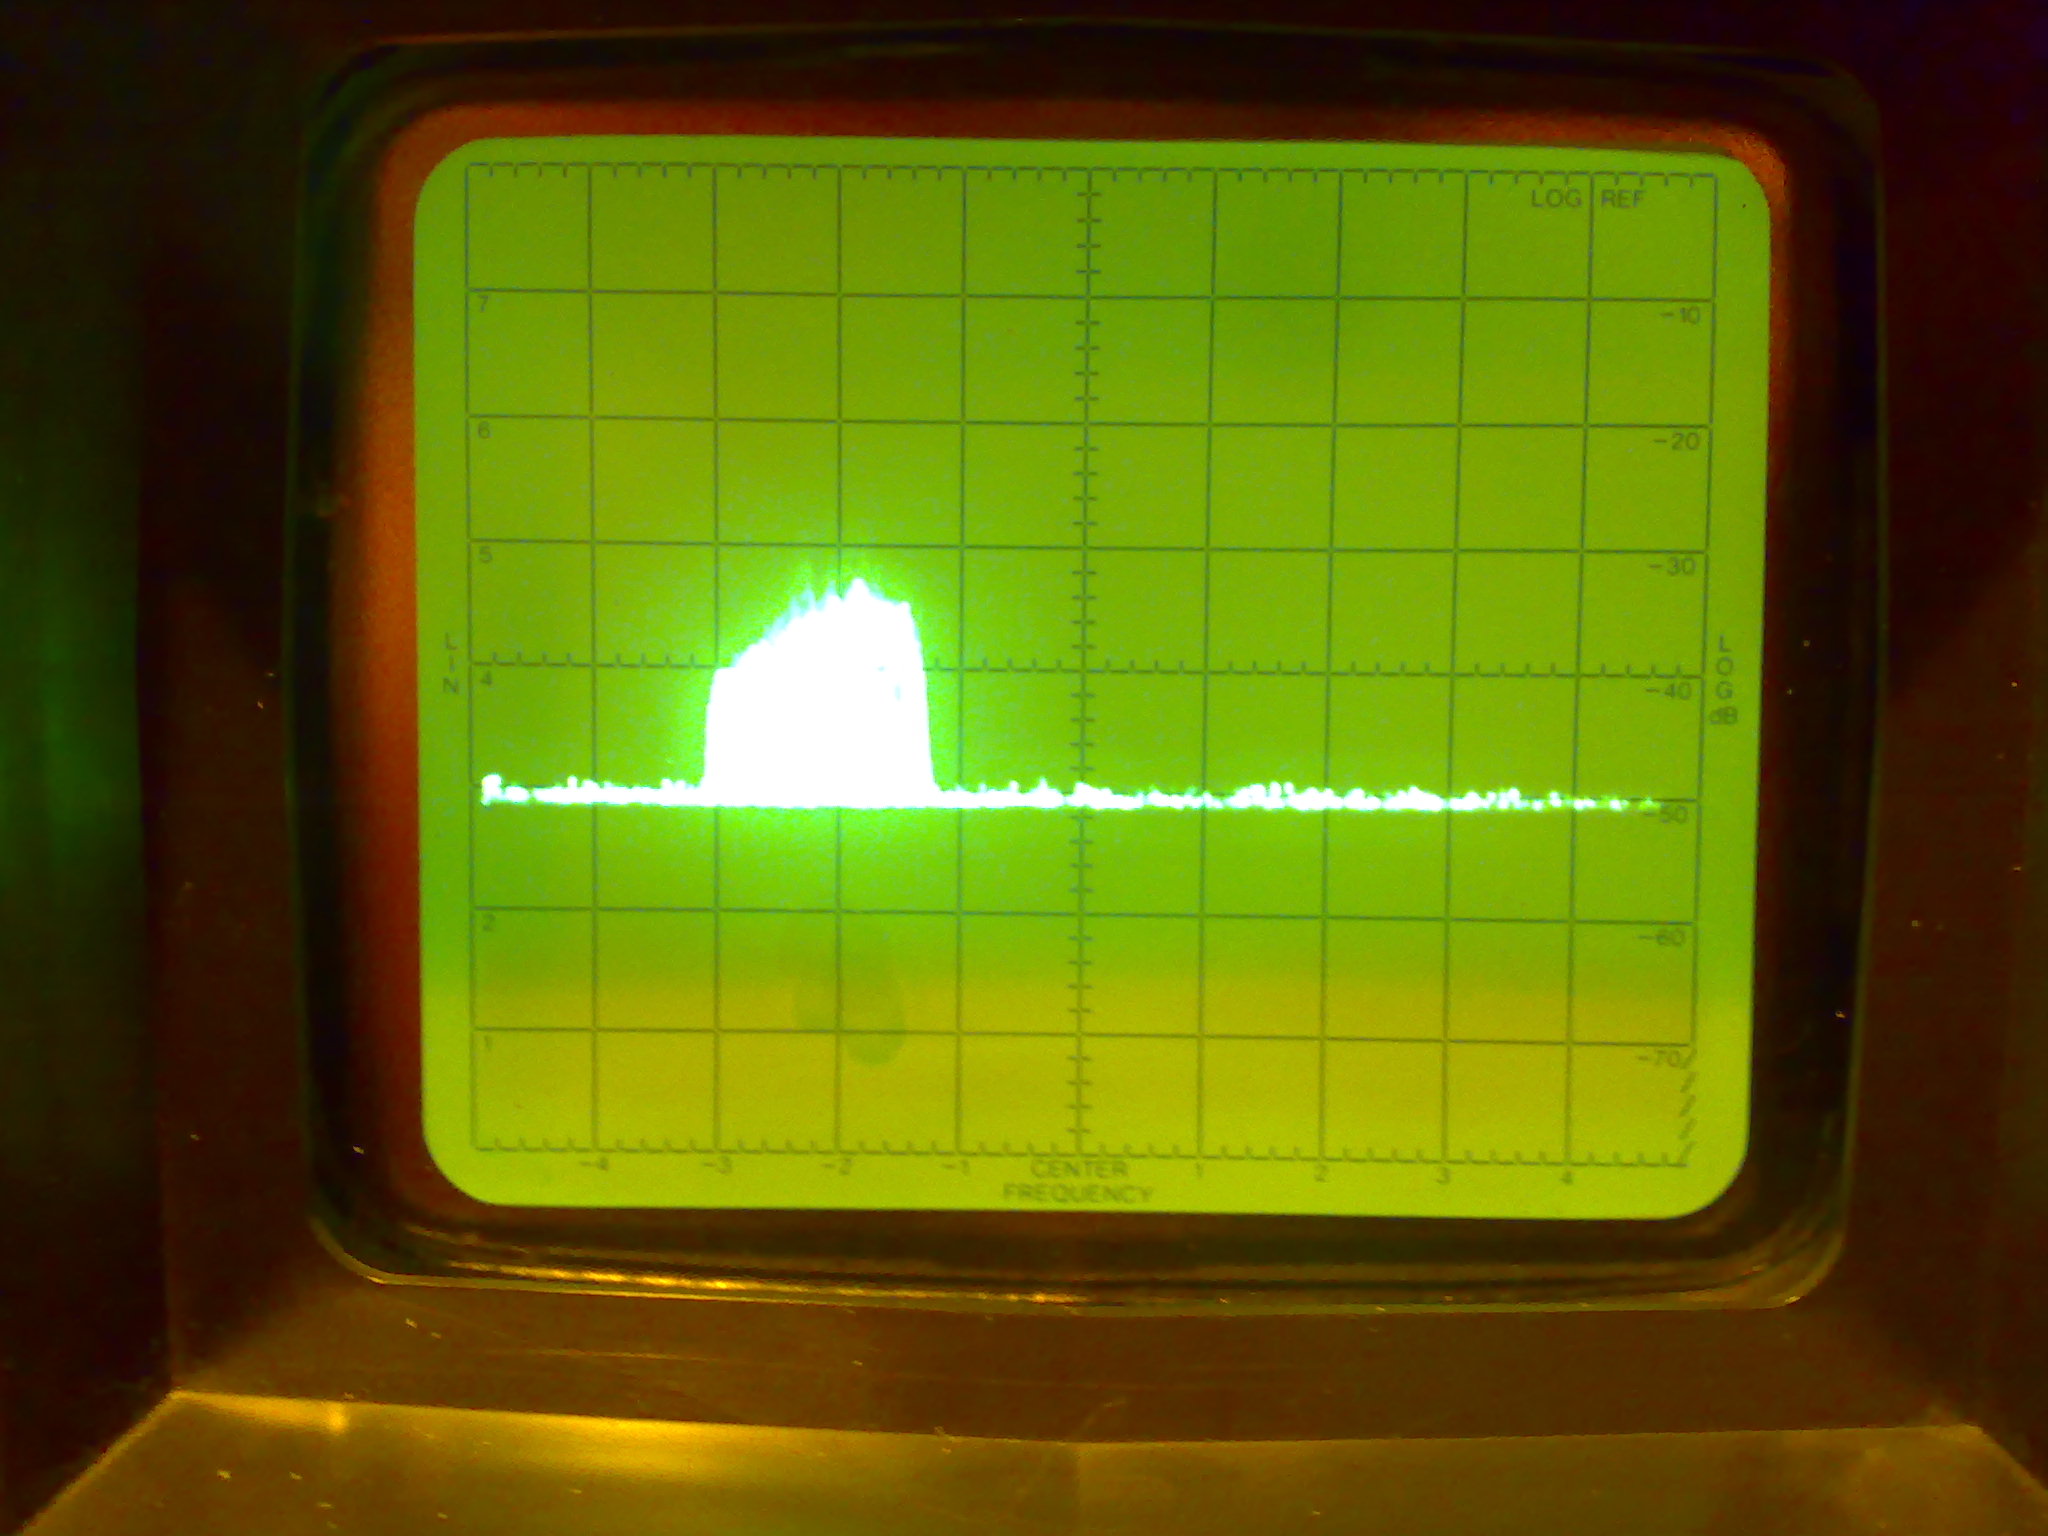
The spectrum below is a local FM station at 99.1 MHz. The counter above is actually reading low because the tracking generator wasn't adjusted.
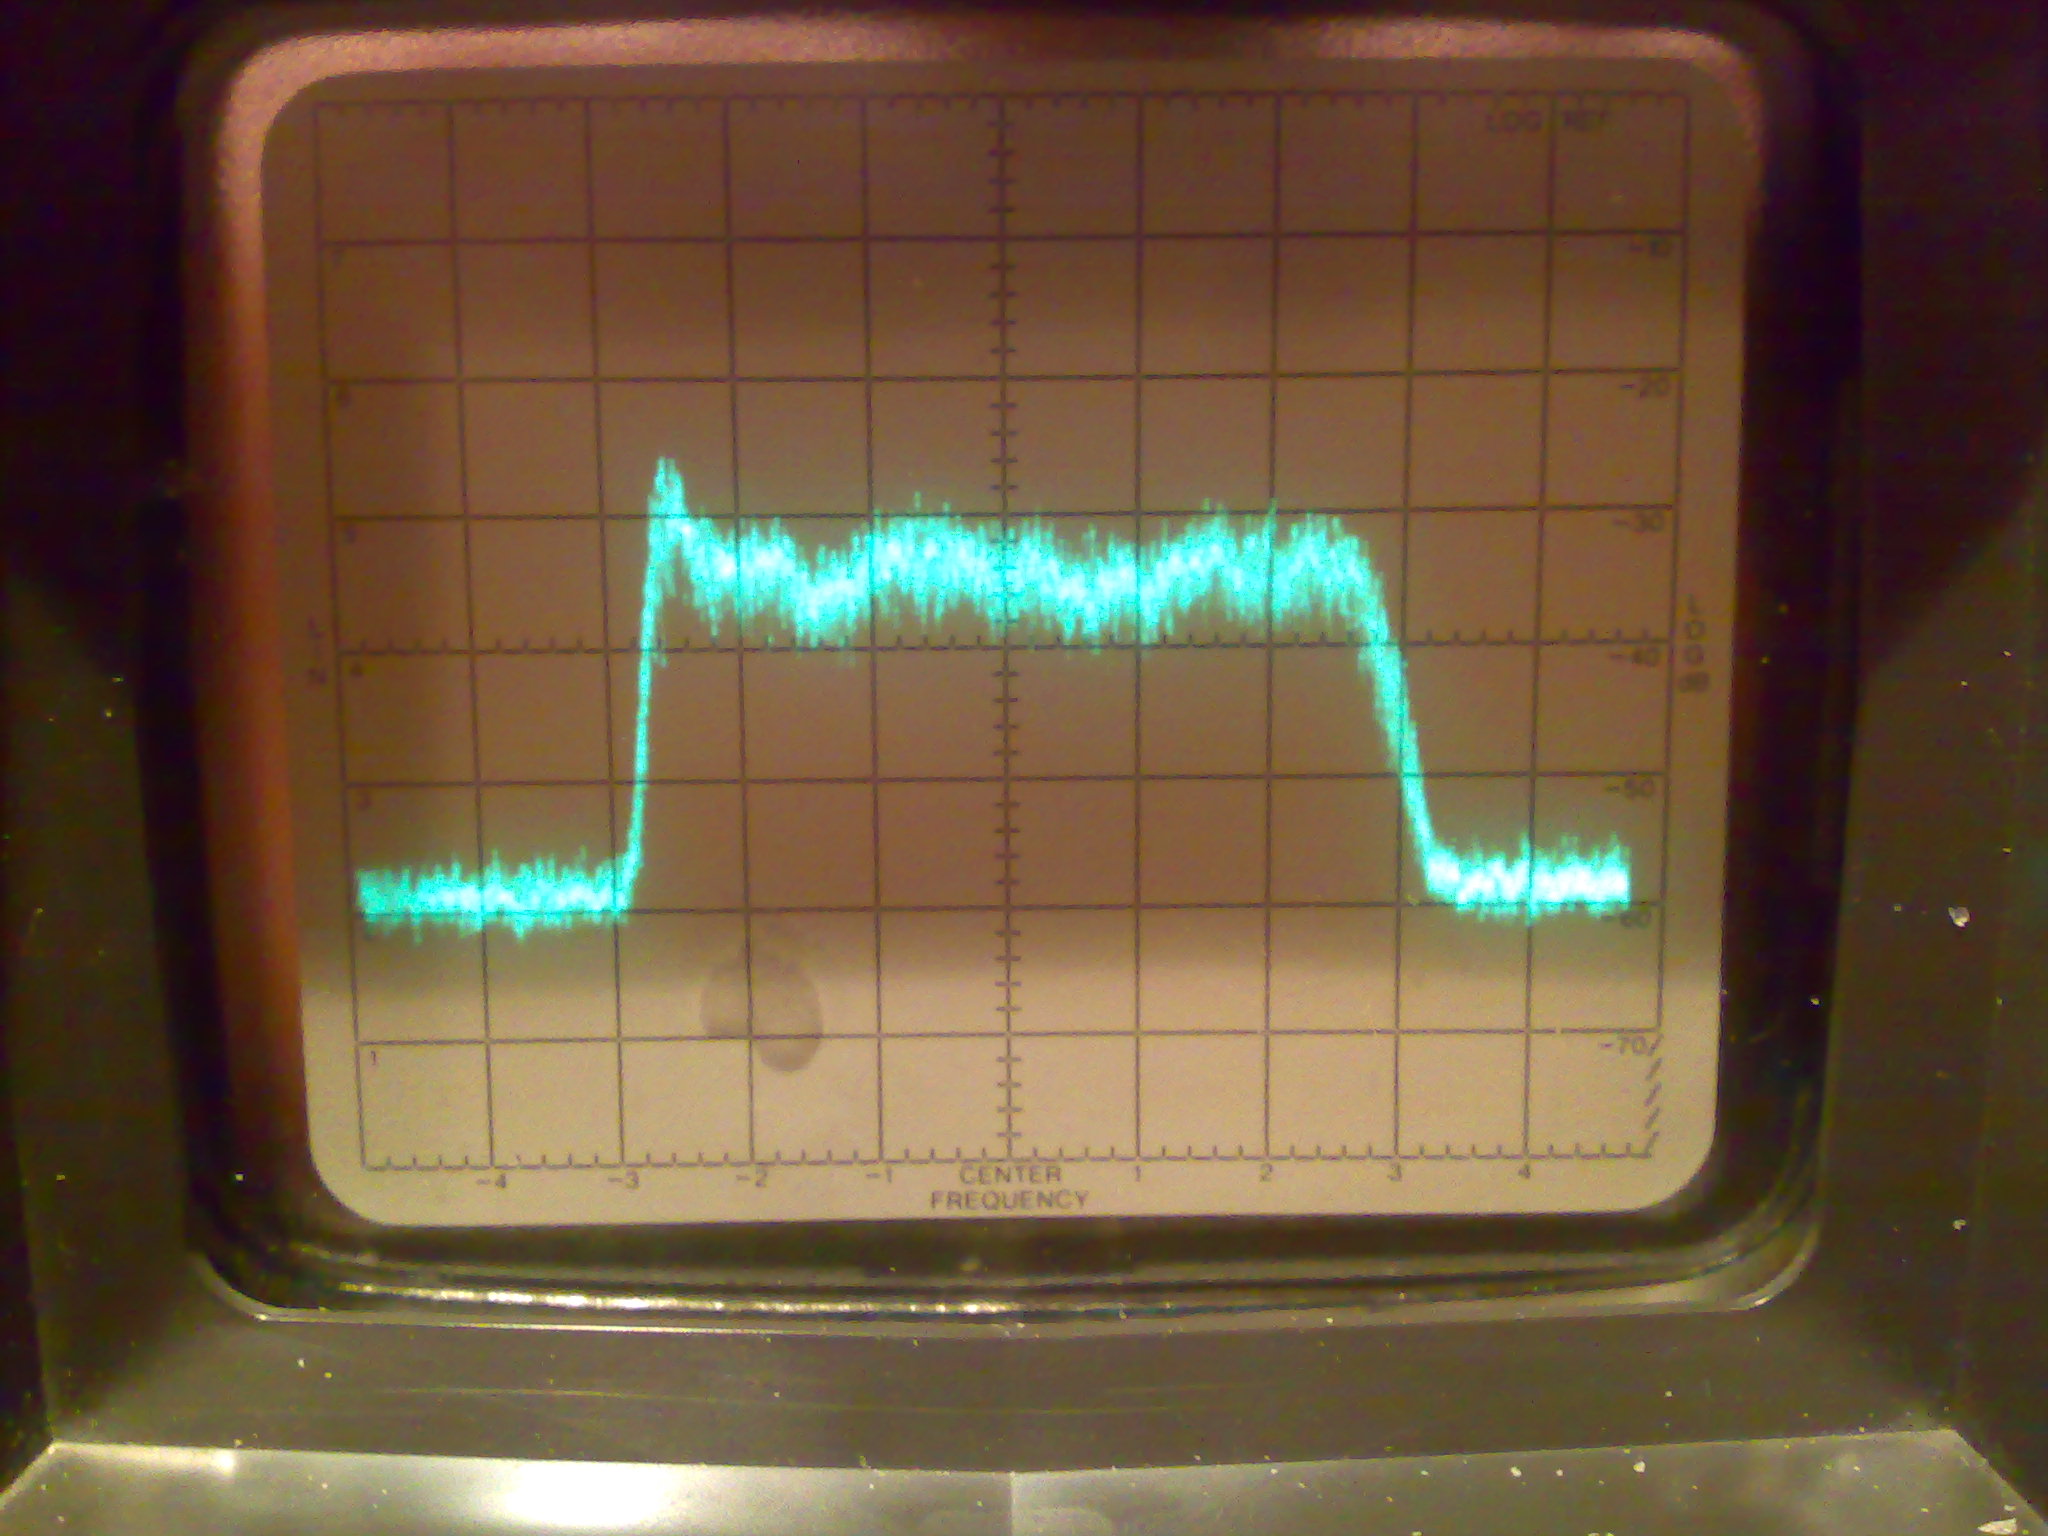
Below is the local ATSC TV station CTV on VHF channel 9. 1 MHz per division; the signal is nominally 6 MHz wide as it should be.
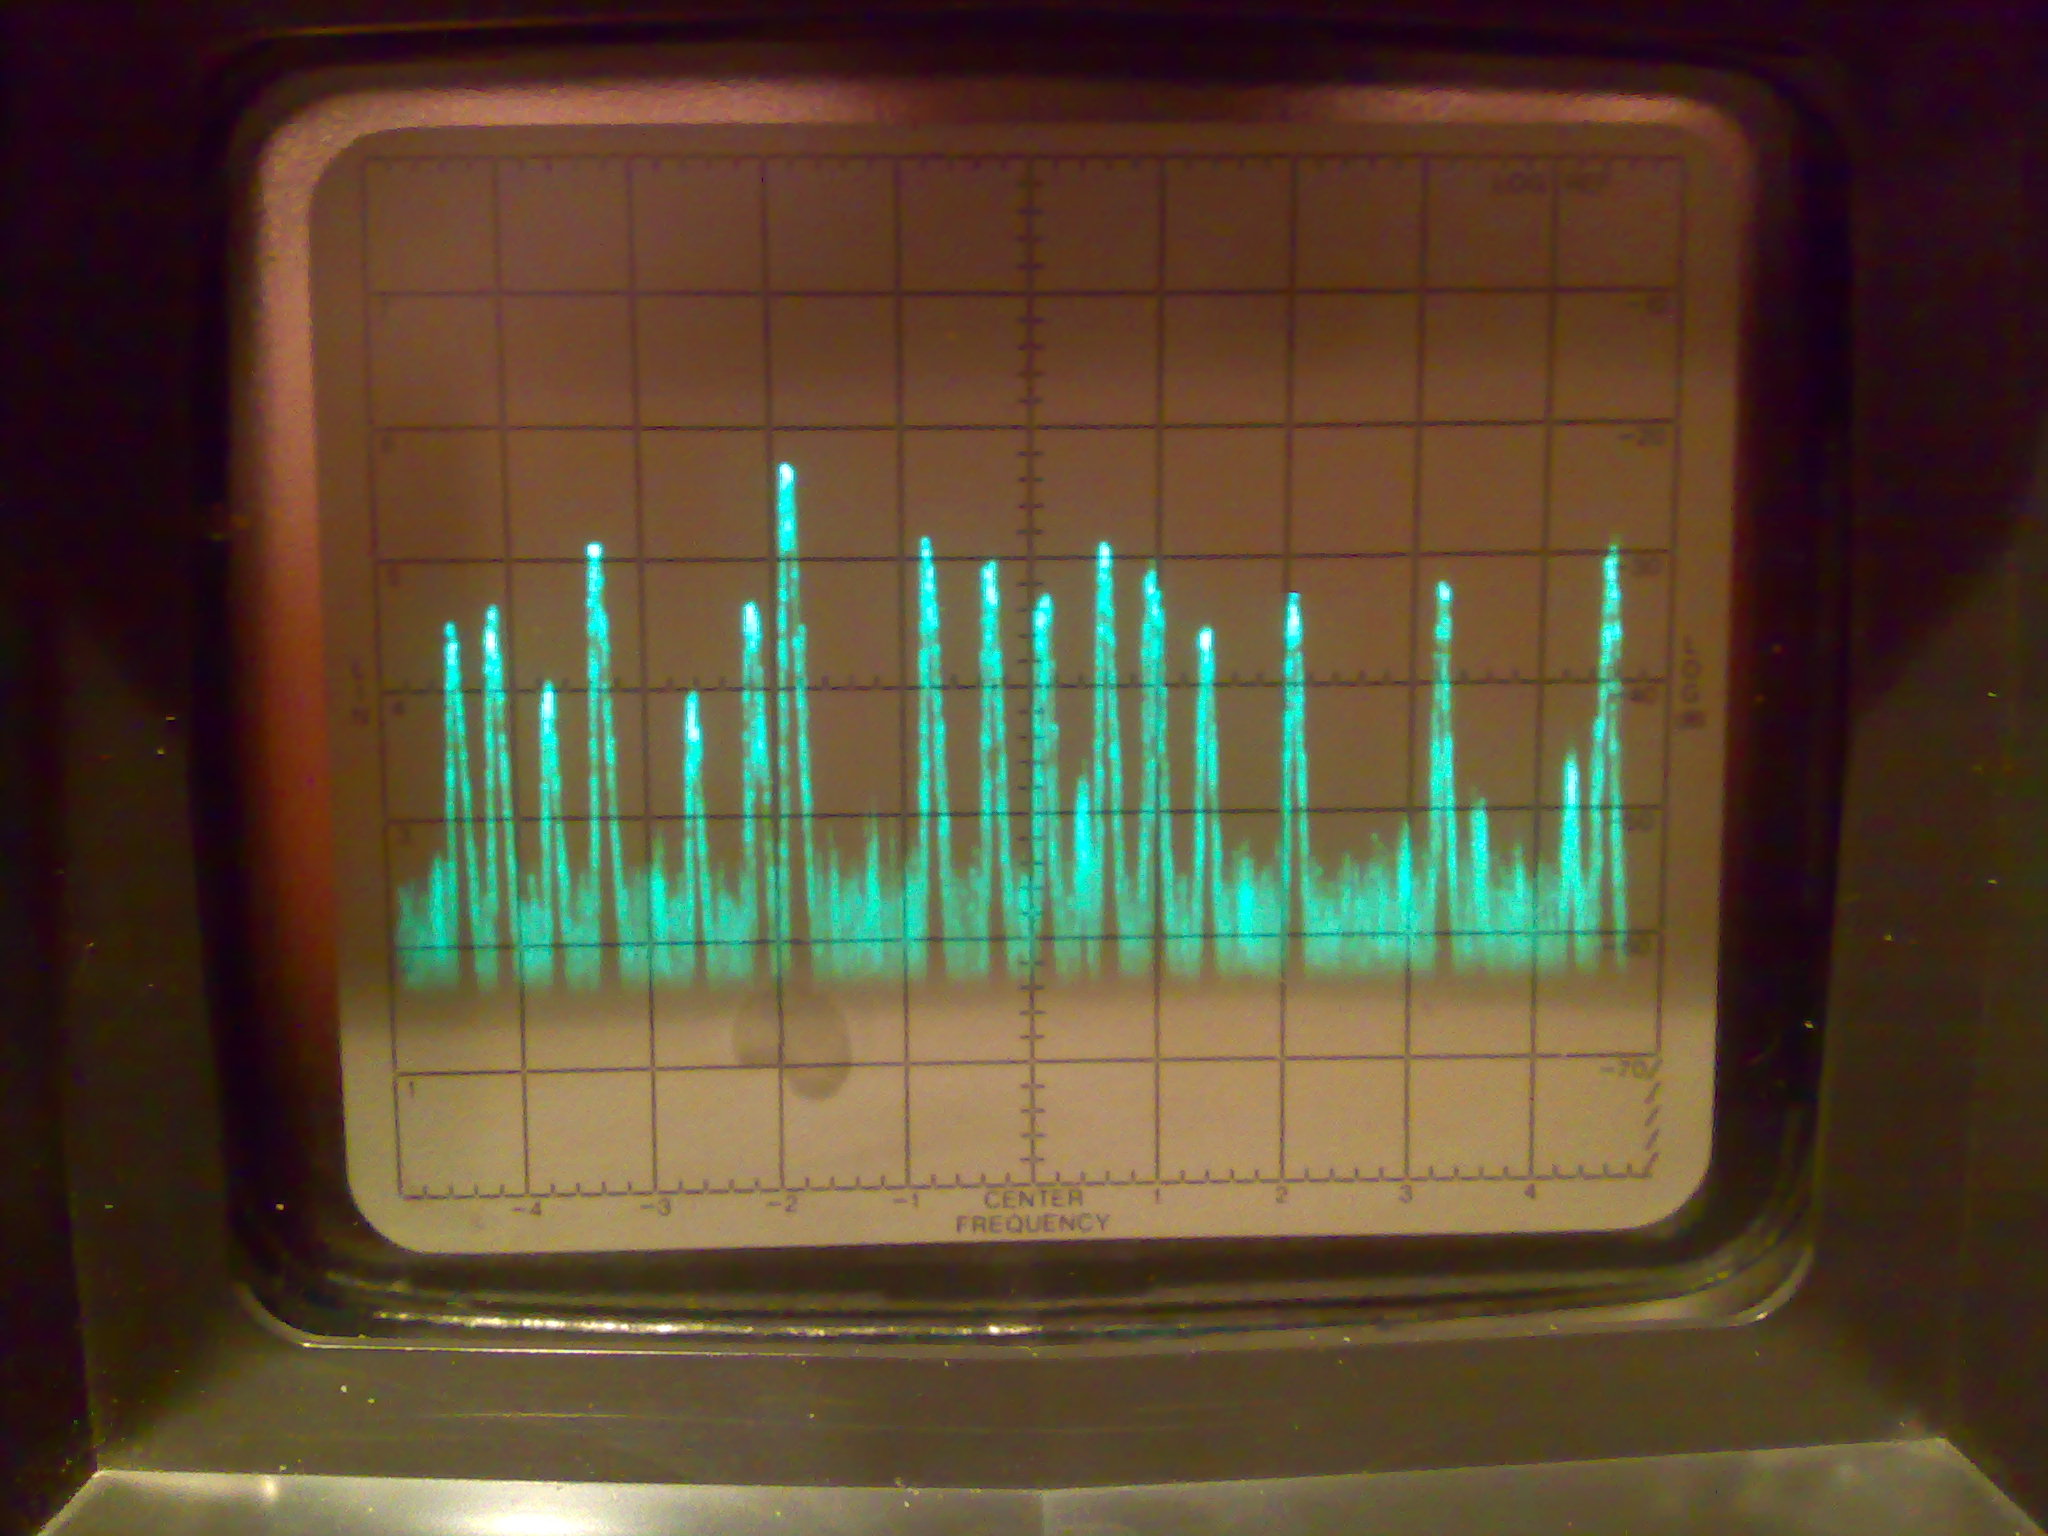
Below is the entire FM broadcast band. Each spike is one station. Toronto is crowded.
Below is a scan of the 2.4GHz WiFi band. This is using the storage tube feature of the display. Because WiFi is so bursty, this image was obtained by letting it accumulate for about 20 seconds. Another useful feature is "single scan", where you do a single sweep of the spectrum and view the results at your leisure. This can be useful for rapidly changing signals. Anyway, in this case it just goes to show that I didn't have any interfering neighbour stations when I took this particular shot.